Categories
About UsHow to get startedAccount AccessBrokers and TradingChartsScannersResearch ToolsCommunityOptionsFuturesAlertsHow to use Time and Sales
Want to see where the real exchange trades are?
Take advantage of the Time & Sales feature that's ONLY available to Tradier Stocks & Options members!
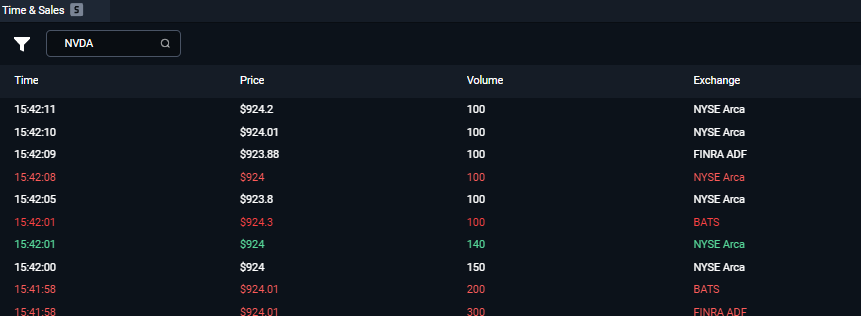
To find the Time & Sales component, you will want to go the Main Menu which is located at the top left corner of your WealthCharts platform. After that, search for Time & Sales or go to the Trading category to load it! Once Time & Sales loads, it will show you the below as a table:
Time
Price
Volume of Trade
Exchange
When the different entries come in, you will notice shades of 3 different colors: red, white, and green. These different colors indicate whether the trade occurred on in, or outside the bid or ask. Take a look at the list below to see the different exchanges that you can filter for in the Time & Sales feature.
Here is a list of exchanges the Time & Sales component looks at:
NYSE MKT
NASDAQ OMX BX
NSE
FINRA ADF
Market Independent
Mutual Funds/Money Markets
ISE
Direct Edge A
Direct Edge X
LTSE
NYSE Chicago
NYSE
NYSE Arca
NASDAQ OMX
NASDAQ Small Cap
NASDAQ Int
OTCBB
OTC other
CBOE
NASDAQ OMX PSX
GLOBEX
BATS Y-Exchange
BATS
While in the Time & Sales Filter, you can filter for price and volume as well as hide certain columns that aren't of interest to you! Please remember to save your layout if you wish to save these settings after confirming them!
⭐Pro Tip: Did you know that you can symbol link an option chart to your Time & Sales component? Use the Option Lookup menu to find your specific chart after searching for your symbol and then symbol link it to the Time & Sales feature! See the related articles below to learn more.