Categories
About UsHow to get startedAccount AccessBrokers and TradingChartsSmart Money Scanner
Looking to find where the money is moving inside of a company? The Smart Money Scanner from WealthCharts has you covered!
To find the Smart Money Scanner feature, head over to the Main Menu at the top left corner of your platform, go to Premium Features and you will locate it there!
When Smart Money Scanner is loaded onto your screen, you will see a screen similar to the image below. Follow the numbered bullets to learn more about each item on the scanner!
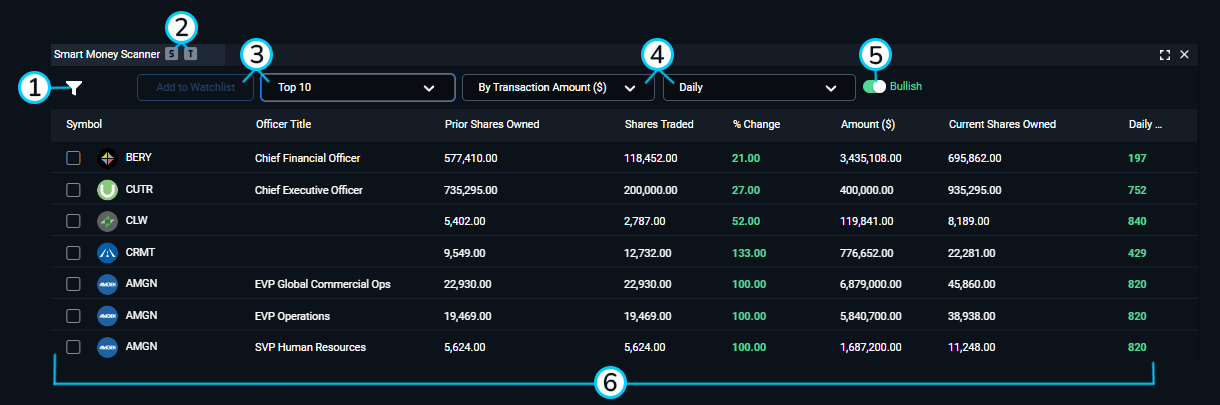
1. Filter Menu: This is where you can change the settings and filters on the Smart Money Scanner feature. Filter out the noise by specifically filtering for Volume, Prior Shares Owned, Shares Traded, the %change, the amount of money ($) traded, current shares owned, and the WealthScore. Take advantage of hiding certain columns you don't want to see in the Column Visibility section. You can change what Watchlist your added symbols go to by going to the Default Watchlist section.

2. Symbol & Timeframe link: Link Smart Money Scanner to your charts and click on any of the symbols to change them! Make sure that Smart Money Scanner and Charts are linked with the same color.
3. Add to Watchlist & Top Amounts: Want to add symbols to your watchlist? Be sure to check the box by the symbol and the two buttons will light up allowing you to move to the next step. You can also change the amount of entries that are showing in your scanner by going from the Top 5, to the Top 10, and to the Top 25.
4. Transaction Amount or Percent Change & Timeframe Dropdown: Click these dropdown menus to view more information. By default, the scanner will show you "By Transaction Amount($)" which organizes the entries to show you the highest amounts in the Amount ($) column. If you switch it to "By Position % Change" you will see different entries appear in your scanner. As of right now, the only timeframe compatible with Smart Money Scanner is the Daily timeframe.
5. Bullish / Bearish Toggle: The bullish option will show purchases in the Shares Traded column. Switching this to the Bearish side will show you selling transactions in the Shares Traded column.
6. Smart Money Scanner Grid:
Symbol: This column shows the different symbols that are in the top range for bullish or bearish signals in Smart Money Scanner. Click the column header to sort through the symbols alphabetically.
Volume: The 5-day average of the company's Volume.
Filing Date: Shows the date of when the transaction was filed.
Issuer Name: Shows the name of the issuer. This is similar to the symbol column.
Owner Name: This shows the person's name that holds the title of who purchased or sold the shares.
Officer Title: This shows the title of what the person holds in the company listed in the entry.
Prior Shares Owned: This column shows the prior amount of shares that were owned before the transaction.
Shares Traded: This column shows the amount of shares that were traded in the transaction.
% Change: This column shows the percent change increase or decrease from columns Prior Shares Owned and Shares Traded.
Amount ($): This is how much the amount of shares in the Share Traded column cost.
Current Shares Owned: This column adds Prior Shares Owned and Shares Traded together.
Daily WealthScore: Looking for a trade idea? See how well this instrument is performing with the algorithms from WealthScore!
To see Smart Money Scanner in action, please review the video below for more: